I hope to actually post a workflow of what I'm doing here at a later time. That, and I'll probably drop a few expletives with regard to projections. For right now, just a quick overview.
I have a major habit of diving into the most random GIS (Geographic Information System) projects, usually sometime around midnight. By then, the kids are in bed, I've spent some quality time with my wife, and the ol' noggin is starting to relax. While this does nothing favorable for early wake-up calls the next morning, it does provide a fun outlet to explore the lands that interest me the most.
I never considered that I'd be one to blog about these projects, but because so many of them border on the adventures I try to chronicle on this site, it does feel right.
My last big project came on the heels of reading about the wonderful work done on landscape visualization by Bjørn Sandvik over at his thematic mapping blog. I began by playing around with a few DEMs I had laying on the hard drive, namely of the quadrangles around Bend and the area of Mount Hood.
-- Intermission for technical venting:
Can I just say how much I regretted deleting my Ubuntu installation a few months back? While totally doable, I had one helluva time getting Windows 7 to play nicely with the different requirements of GDAL, Mapnik, Python, Perl, IIS, etc. In any case, things are happy on this Microsoft box for the moment...
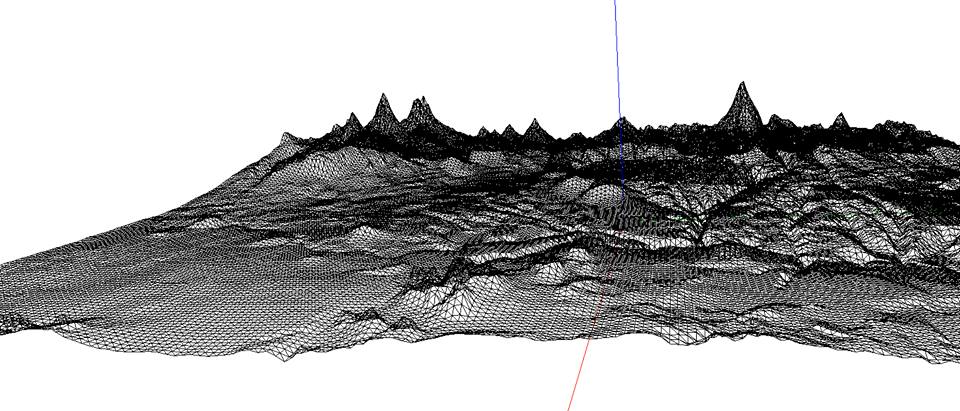
After playing around with the pretty amazing three.js functionality and the great tutorials laid out by Bjørn, I began cranking out some rough landscape visualizations of Bend, Oregon up through the Central Cascades. The scaling was horrible out of the gate, and was tempered a bit as seen in the framed image above. A little more adjusting, and the addition of a crappy land cover did the trick to at least bring the area to life.
I have a major habit of diving into the most random GIS (Geographic Information System) projects, usually sometime around midnight. By then, the kids are in bed, I've spent some quality time with my wife, and the ol' noggin is starting to relax. While this does nothing favorable for early wake-up calls the next morning, it does provide a fun outlet to explore the lands that interest me the most.
I never considered that I'd be one to blog about these projects, but because so many of them border on the adventures I try to chronicle on this site, it does feel right.
My last big project came on the heels of reading about the wonderful work done on landscape visualization by Bjørn Sandvik over at his thematic mapping blog. I began by playing around with a few DEMs I had laying on the hard drive, namely of the quadrangles around Bend and the area of Mount Hood.
-- Intermission for technical venting:
Can I just say how much I regretted deleting my Ubuntu installation a few months back? While totally doable, I had one helluva time getting Windows 7 to play nicely with the different requirements of GDAL, Mapnik, Python, Perl, IIS, etc. In any case, things are happy on this Microsoft box for the moment...
After playing around with the pretty amazing three.js functionality and the great tutorials laid out by Bjørn, I began cranking out some rough landscape visualizations of Bend, Oregon up through the Central Cascades. The scaling was horrible out of the gate, and was tempered a bit as seen in the framed image above. A little more adjusting, and the addition of a crappy land cover did the trick to at least bring the area to life.
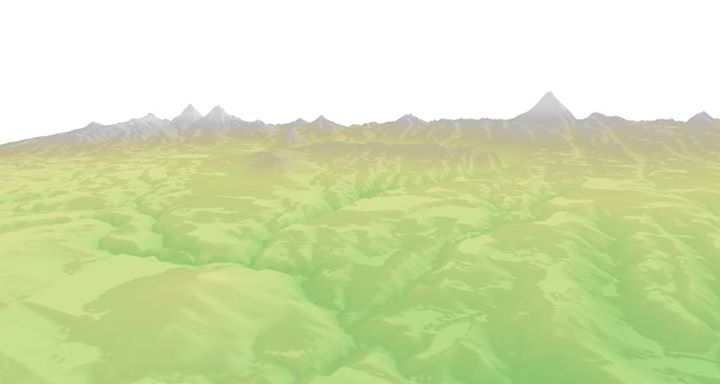
While aesthetically there was much to be desired, the drainage systems of the area were well represented. Furthermore, you could actually note Jefferson down to North and Middle Sisters, as well as Tam MacArthur Rim. The bonus was seeing the little valley that the Metolius flows northward through.
If you want a closer look, check it out here or click the respective pictures. A word of warning: If you're not using a WebGL-enabled browser, you may be bored and not see any of the pretty stuff. Newer versions of Chrome work nicely, Firefox is hit-and-miss, Safari typically needs to have WebGL enabled manually, and IE just doesn't work. A quick little browser check can be found at http://get.webgl.org.
On a side note, I'm hosting this via my Google Drive account. Weebly, who hosts this blog, does not allow some of the JavaScript madness contained therein. I tried, and maybe there is a way, but none of my screwing around made it work. One day I'll host this on an adult server and get to play for real!
I used another DEM to do the same with the area around Mount Hood, up past the Columbia River, and east toward the Dalles. I was much happier with the terrain coloration and some fun experimentation with Mapnik's symbolizer classes yielded interesting river effects and points of interest (All done by hopping around in QGIS, where I put together a few shapefiles that distinctly attributed the campgrounds and trailheads of Mount Hood National Forest. A little hydrology on top and then the XML merging in Mapnik took shape).
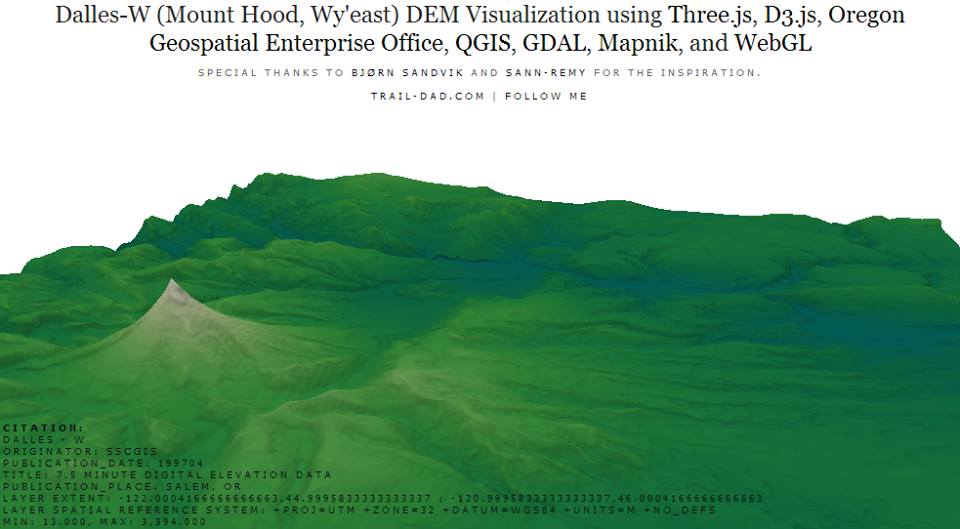
The problem with this visualization, just like the Bend one before it, was largely due to the fact that the resolution sucked. These were DEMs that covered a large area, with resolutions that were less than optimal (all details found on individual pages under the citation).
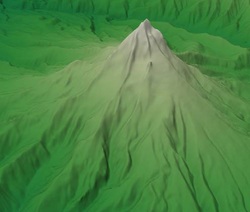
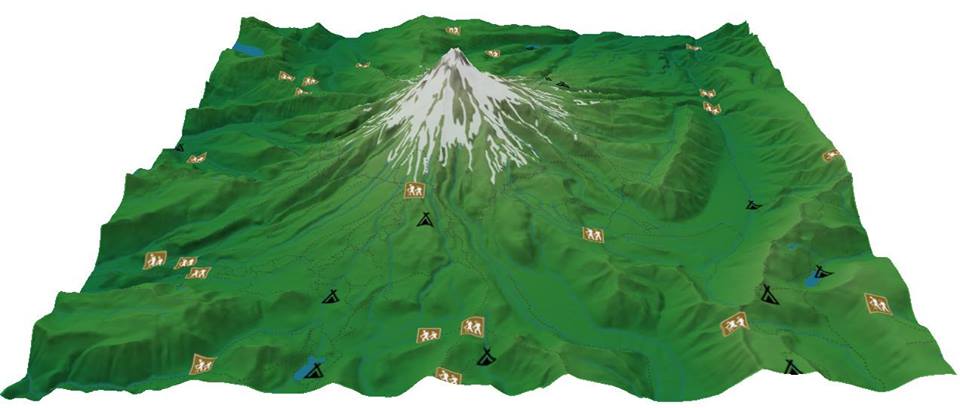
I opted for FTP'ing directly to the Oregon Geospatial libraries, and found the best DEM's possible without spending any money. To give it a shot, I kept with Mount Hood and as can be seen in the image to the right, now some detail was being seen. Hell, I could discern the spot on the Muddy Fork where I broke my foot a few months back!
Playing around with some more shapefile creation and Mapnik magic, I was able to lay out a pretty awesome visualization of Mount Hood that is glacially accurate (?), complete with lakes, trailheads, campgrounds, AND trails (!!!). If you zoom in enough, you'll see the trails dotted all around that majestic mountain.
I still have a lot to work planned, and once I get a bit of time, here's what I'm really hoping to accomplish:
Around the last point, it's been a hoot watching the kids play with these visualizations. Every time I leave them up on the screen, they grab the mouse and fly around the area.
As for documenting things, I'll try to do that here. On the evening I sat down to do that, I froze the computer doing an obscene raster merge and lost the damn file being compiled with my complete workflow (that I hadn't saved).
I opted for FTP'ing directly to the Oregon Geospatial libraries, and found the best DEM's possible without spending any money. To give it a shot, I kept with Mount Hood and as can be seen in the image to the right, now some detail was being seen. Hell, I could discern the spot on the Muddy Fork where I broke my foot a few months back!
Playing around with some more shapefile creation and Mapnik magic, I was able to lay out a pretty awesome visualization of Mount Hood that is glacially accurate (?), complete with lakes, trailheads, campgrounds, AND trails (!!!). If you zoom in enough, you'll see the trails dotted all around that majestic mountain.
I still have a lot to work planned, and once I get a bit of time, here's what I'm really hoping to accomplish:
- In lieu of terrain cover, drape a topographic map mosaic on top of the wire frame.
- Experiment with D3 to see if I can get tooltips or labels to work.
- Work more on the fog functionality; I got it to work after looking at a bunch of examples, but never felt happy with it. I think the limited area being shown right now is the definite problem. That said, fog generated by an exponential squared function is pretty damn cool and lifelike.
- Document and automate much of the process.
- Expand the coverage area to showcase the hikes with my son and daughter.
Around the last point, it's been a hoot watching the kids play with these visualizations. Every time I leave them up on the screen, they grab the mouse and fly around the area.
As for documenting things, I'll try to do that here. On the evening I sat down to do that, I froze the computer doing an obscene raster merge and lost the damn file being compiled with my complete workflow (that I hadn't saved).
 RSS Feed
